UT’s Texas Civic Vitality Report
This project focused on understanding and visualizing voter turnout disparities in Texas, where civic participation consistently ranks among the lowest in the country. Using the Voting Representation Index (VRI), we analyzed which demographic groups are over- or underrepresented at the polls compared to their share of the Voting-Eligible Population (VEP), and how Texas compares to national trends.
To bring these insights to life, I designed an interactive and responsive Tableau dashboard for the 2024 elections. The dashboard allows users to explore voter turnout and representation gaps across age, race, and region both within Texas and in comparison to other U.S. states. It was published by the Annette Strauss Institute and featured in public forums.
I chose Tableau for its strong visualization tools, including dynamic filters and drill-down features, making complex data easy to understand. Collaborative planning and design were supported through FigJam, which helped the team brainstorm ideas, organize data, and align on key metrics efficiently.
ROLE
Data Visualisation
Specialist
TEAM
1 x Research Intern
1 x Postdoctoral Fellow
1 x Data Visualisation Specialist
1 x Director of Annette Strauss
Institute for Civic Life
TIMELINE
4 Months
TOOLS USED
Tableau
Confluence
FigJam
MSSuite
PROBLEM STATEMENT
Despite being one of the largest and most diverse states in the U.S., Texas consistently ranks among the lowest in voter turnout, raising serious concerns about equitable representation in the democratic process. A lack of accessible, data-driven tools made it difficult for researchers, policymakers, and the public to understand which demographic groups are underrepresented at the polls and how turnout disparities in Texas compare nationally.
To address this gap, I stepped in as a Data Visualization Specialist to design a solution that could transform complex voter data into an interactive, easy-to-use format. By developing a responsive Tableau dashboard, I enabled stakeholders to explore turnout ratios and the Voting Representation Index (VRI) across key demographics such as age, race, and region and compare Texas' performance with national benchmarks. This dashboard published by the Annette Strauss Institute, has since been used to inform discussions on civic engagement and voting reform.
MY APPROACH
01.
Processed and analyzed 10,000+ rows of voter and demographic data from national sources such as the U.S. Census CPS and University of Florida Election Lab, applying advanced weighting methods (e.g., Hur and Achen) to correct for survey bias.
02.
Built an interactive Tableau dashboard using advanced features like Level of Detail (LOD) expressions, parameter controls, and dynamic filters to explore trends in turnout, VRI, and demographic representation across states and election cycles.
03.
Designed intuitive, insightful visualizations with dual-axis charts, custom tooltips, and color-coded indicators that clearly highlight underrepresented voter groups and compare Texas data to national benchmarks.
04.
Adopted an Agile, iterative process to validate calculations and logic, regularly syncing with the team to ensure alignment on functionality and accuracy of the displayed results throughout each development sprint.
05.
Utilized FigJam, Confluence, and Microsoft Suite to map complex formulas (like VRI), document data workflows, and ensure transparency and collaboration across the project lifecycle.
INTRODUCTION
The Texas Civic Vitality Report Dashboard, developed by me and my team at The University of Texas at Austin, offers an interactive exploration of voter turnout patterns across Texas and the United States. Utilizing data from the U.S. Census Bureau’s Current Population Survey and the University of Florida’s Election Lab, the dashboard provides insights into how various demographic groups—such as age, education, income, and race/ethnicity—are represented in the electorate. By employing the Voting Representation Index (VRI), users can assess whether specific groups are voting at, above, or below their proportion of the voting-eligible population. This tool serves as a valuable resource for policymakers, educators, and civic organizations aiming to understand and address disparities in voter participation, thereby strengthening democratic engagement in Texas.
SOLUTION

WHAT DID I LEARN
01
Thriving in Fast-Paced Environments: I learned how to operate under tight deadlines, efficiently prioritizing tasks and making quick decisions without compromising on quality, an essential skill for managing agile product cycles.
02
Decoding Complexity: I developed a deeper understanding of complex electoral terms and their dependencies within the dataset. This helped me ensure the data narrative was both accurate and meaningful, a skill that directly translates to making informed, data-driven product decisions.
03
Advanced Tableau Proficiency: I explored and applied advanced Tableau features such as calculated fields, parameter controls, tooltips customization, and data blending. These technical capabilities enhanced the functionality and interactivity of the dashboard.
04
Stakeholder Collaboration: Collaborating with non-technical stakeholders helped me refine my communication skills. I learned how to break down complex data relationships and translate them into intuitive visual stories that align with user needs and goals.
05
Iterative Design Thinking: Repeatedly incorporating feedback into the dashboard taught me the value of iteration and user-centric design, core principles in both product development and data storytelling.
06
Visual Storytelling Mastery: Most importantly, I recognized the power of well-crafted visual storytelling in improving user comprehension. By presenting data in an engaging and structured way, I helped users grasp complex insights more effectively and make informed decisions.
ACHIEVEMENTS
01
I had the unique opportunity to collaborate with the Director of the Annette Strauss Institute for Civic Life and a former Texas State Representative, which deepened my understanding of civic engagement from both academic and legislative perspectives.
02
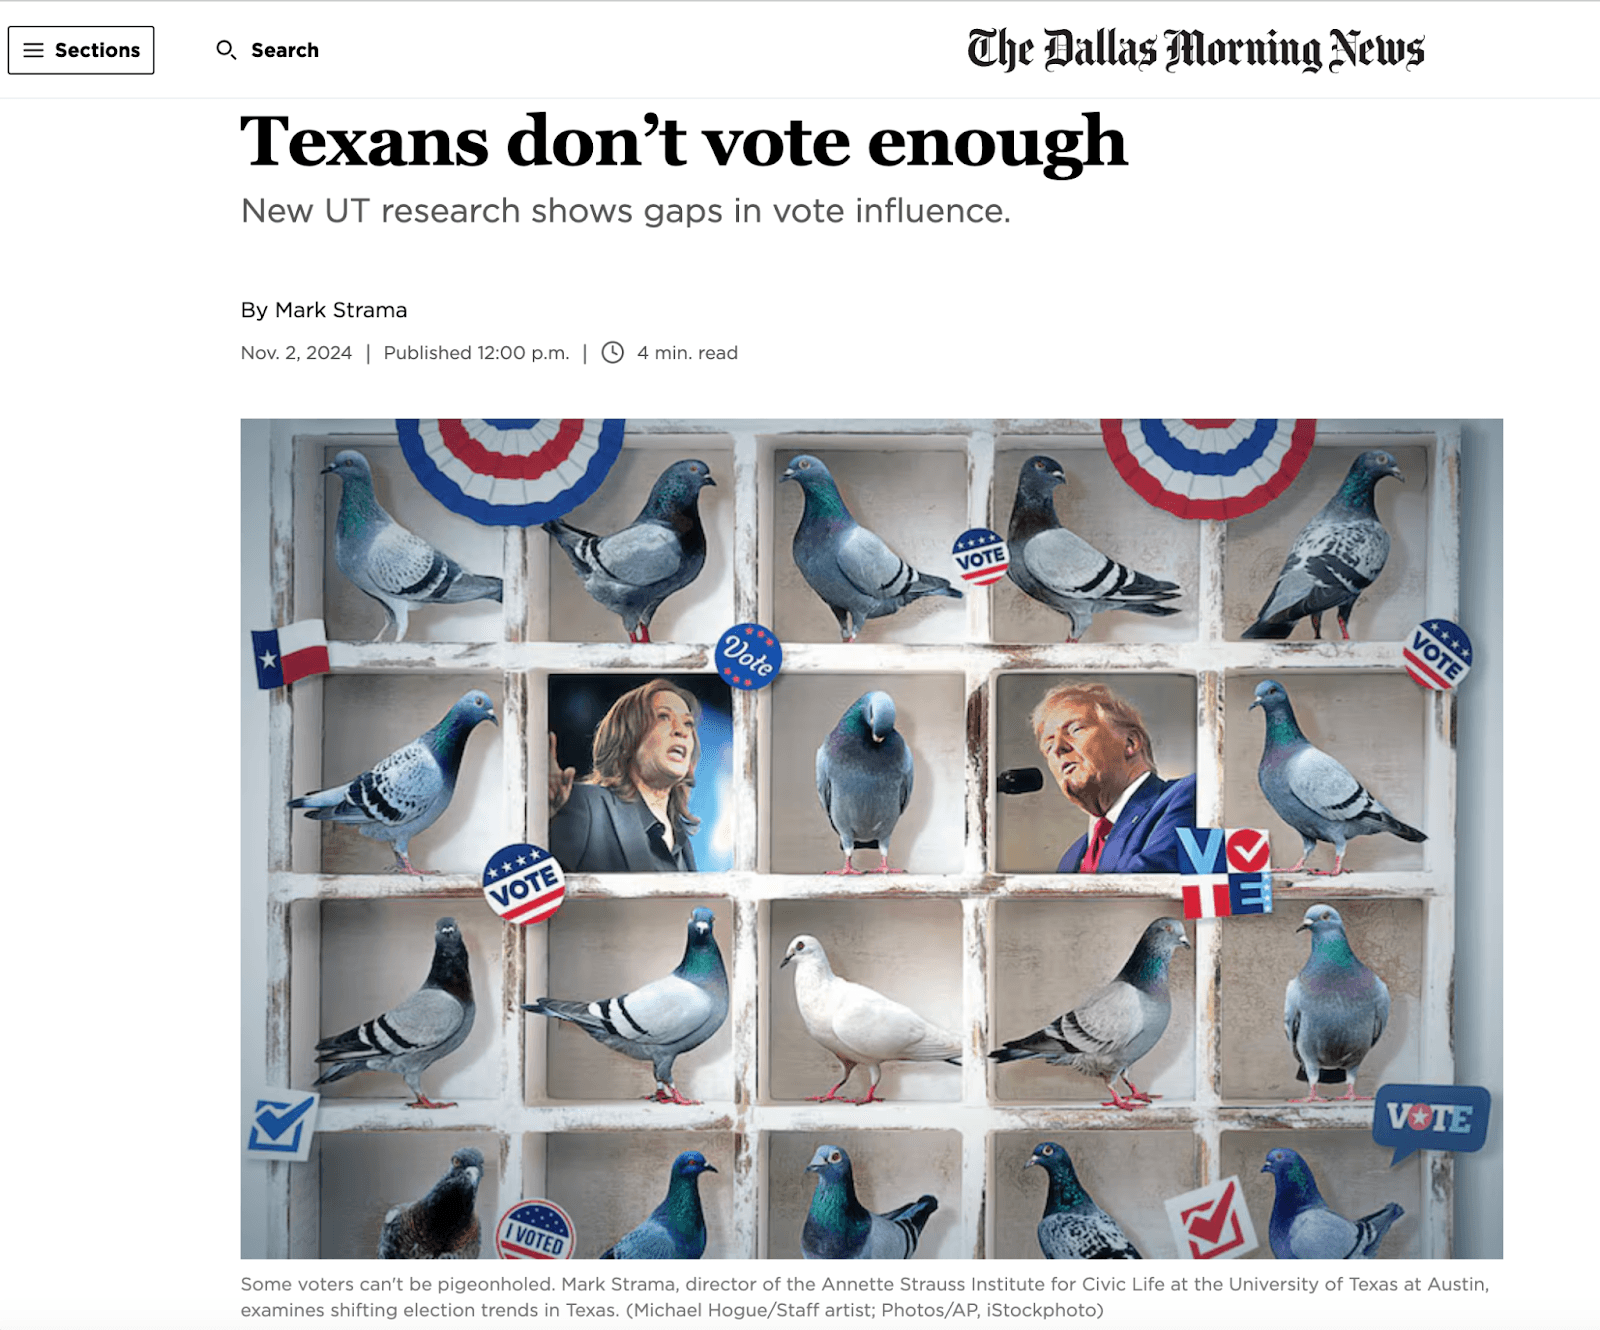
The project received media coverage from KXAN News, was featured in the Dallas Morning News, and was also highlighted in a segment on Spectrum News—affirming the real-world impact and visibility of our work.
03
Working alongside a team of brilliant researchers allowed me to expand both my technical and analytical skillsets. I gained hands-on experience navigating the intricacies of Tableau, developed a strong grasp of election-specific terminology, and learned how to collaborate effectively across disciplines.